
TI-84 Calculator Online
Use our free TI-84 Calculator Online to perform scientific calculations, graph equations, solve advanced math problems, and analyze statistical data—all directly in your browser. No downloads, installations, or sign-ups required. Fast, accurate, and easy to use on any desktop, tablet, or mobile device.
SIN sin(x) in degreesCOS cos(x) in degreesTAN tan(x) in degreesLOG log base 10LN natural log√ square rootx^ exponent (e.g. 2^8)π pi = 3.14159…(-) negative numberEE scientific notationY= enter graph equationSTAT mean, median, std devTI-84 Calculator Online: Free Graphing Calculator in Your Browser
TI-84 calculator online is a free graphing calculator that runs directly in your browser — no download, no app, and no Texas Instruments hardware required. It replicates the core functions of the TI-84 Plus, including scientific calculations, equation graphing, and statistical analysis, making it useful for students, teachers, and anyone who needs a graphing calculator without buying the physical device. Everything runs on your own device, so there is nothing to install and no account to create.
What Is the TI-84 Calculator?
The TI-84 Plus is a graphing calculator manufactured by Texas Instruments and widely used in high school and college mathematics, science, and statistics courses. It is one of the most commonly required calculators for standardized tests including the SAT, ACT, and AP exams. The TI-84 can perform standard arithmetic, trigonometric and logarithmic calculations, graph multiple equations on a coordinate plane, and run statistical analyses on data sets.
The physical TI-84 costs between $90 and $130 USD depending on the model. This free online version covers the most essential functions used in academic settings, making it a practical alternative for homework, study sessions, and situations where the physical calculator is not available.
How to Use the TI-84 Online Calculator
The online calculator has three modes accessible from the tabs at the top of the screen. Each mode mirrors one of the primary uses of the physical TI-84.
How to Use Calculator Mode
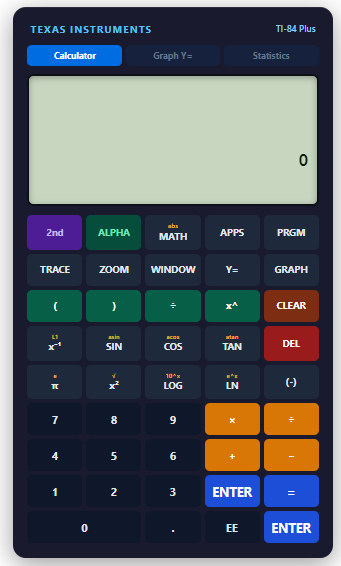
Calculator mode is the default view and works like the standard calculator on the TI-84. Click or tap any button to build your expression in the screen at the top. The display shows your current expression on the upper line and the result on the lower line, exactly as the physical TI-84 displays calculations.
Press the ENTER or = button to evaluate the expression. The result appears on the lower line and the previous calculation moves up into the history section above it, where the last three calculations remain visible — just as they do on the physical device. You can also type numbers and operators directly on your keyboard if you are using a computer.
After calculating a result, the result value becomes the starting point for the next expression, so you can chain calculations together without re-entering the previous answer.
How to Use Graph Y= Mode

Graph mode lets you enter any equation and see it plotted on a coordinate plane. To use it, switch to the Graph Y= tab, type your equation into the Y1 field using x as the variable, and click Graph. Common examples include x^2-4 for a parabola, sin(x) for a sine wave, or x^3-2*x for a cubic curve.
The four fields below the equation input let you set the viewing window — the minimum and maximum values for both the x and y axes. Adjusting these values is equivalent to using the WINDOW menu on the physical TI-84 to zoom in or out on different parts of the graph. The default window is set to -10 to 10 on both axes, which works for most introductory algebra and precalculus equations.
The graph displays a coordinate grid with axis labels so you can read approximate values directly from the plot.
How to Use Statistics Mode
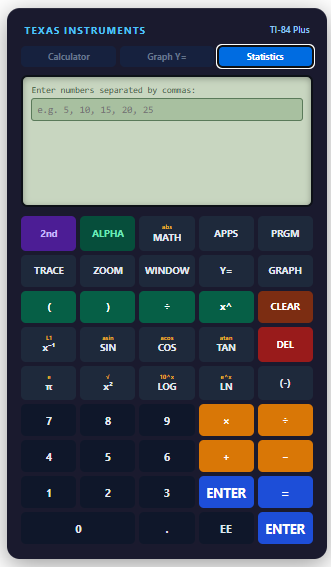
Statistics mode accepts a list of numbers and calculates all the key descriptive statistics automatically. Switch to the Statistics tab, type your data values separated by commas, and the results update in real time as you enter numbers.
The output shows the sample size (n), mean (x̄), sum of all values (Σx), median, minimum, first quartile (Q1), third quartile (Q3), maximum, population standard deviation (σx), and sample standard deviation (Sx). These are the same statistics that the TI-84’s 1-Var Stats function calculates from the STAT menu.
Scientific Functions Available in Calculator Mode
The online TI-84 includes all the major scientific functions available on the physical calculator.
Trigonometric Functions
The SIN, COS, and TAN buttons calculate the sine, cosine, and tangent of any angle entered in degrees. This matches the default degree mode of the TI-84. For example, clicking SIN, entering 30, and pressing ENTER returns 0.5, because the sine of 30 degrees is 0.5. The same applies to COS and TAN for any angle value.
Logarithmic Functions
The LOG button calculates the base-10 logarithm of a number, and the LN button calculates the natural logarithm (base e). These match the LOG and LN keys on the physical TI-84 exactly. For example, LOG(100) returns 2, because 10 to the power of 2 equals 100.
Square Root and Exponents
The √ button opens a square root expression. The x^ button lets you raise a number to any power. For example, entering 2^8 and pressing ENTER returns 256, because 2 raised to the power of 8 is 256. These correspond to the √ and ^ keys on the physical calculator.
Constants and Special Values
The π button inserts the value of pi (approximately 3.14159265358979). The (-) button enters a negative number — matching the TI-84’s dedicated negative sign key, which is separate from the subtraction operator. The EE button is used for scientific notation entry, allowing you to enter values like 6.02 × 10²³.
How to Graph Equations on the TI-84 Online
Graphing is one of the most important features of the TI-84 and one that is not available on basic scientific calculators. The online graph mode supports a wide range of equation types.
Graphing a Parabola
To graph a quadratic equation such as y = x² − 4, enter x^2-4 in the Y1 field and click Graph. The parabola appears on the coordinate grid with its vertex and intercepts visible. Adjust the window range if the important parts of the graph fall outside the default view.
Graphing Trigonometric Functions
To graph y = sin(x), enter sin(x) in the Y1 field. For a cleaner view of the sine wave, set the x range to -360 to 360 degrees and the y range to -2 to 2. The graph shows the full oscillating sine wave across multiple periods.
Graphing Polynomial Functions
Higher degree polynomials are entered using the ^ operator. For a cubic function y = x³ − 2x, enter x^3-2x in the Y1 field. Use an asterisk () between a coefficient and x, or the tool will interpret them separately. The resulting graph shows the characteristic S-curve of a cubic polynomial with its turning points.
Using the Statistics Functions
The statistics mode covers the descriptive statistics content taught in most high school and introductory college statistics courses.
Understanding the Output Values
The mean (x̄) is the arithmetic average of the data set — the sum of all values divided by the number of values. The median is the middle value when the data is sorted in order. For even-numbered data sets, it is the average of the two middle values.
The population standard deviation (σx) measures how spread out the values are around the mean assuming the data represents a complete population. The sample standard deviation (Sx) applies the same concept but with Bessel’s correction (dividing by n−1 instead of n) for when the data is a sample drawn from a larger population. Most statistics courses use Sx for real-world data analysis.
The minimum, Q1 (first quartile), median, Q3 (third quartile), and maximum together form the five-number summary used to construct box plots.
Keyboard Shortcuts for Faster Entry
When using the calculator on a computer, you can type directly rather than clicking buttons. The following keys are supported in Calculator mode.
- Type any digit (0–9) to enter numbers directly.
- Use + − * / for arithmetic operators.
- Use ^ to enter an exponent.
- Press Enter or = to evaluate the expression.
- Press Backspace to delete the last character.
- Press Escape to clear the entire expression.
- Use ( and ) to enter parentheses for grouping.
These shortcuts make entry significantly faster for longer expressions and are especially useful when checking homework or working through multiple practice problems in sequence.
TI-84 Online vs Physical TI-84: What Is the Difference?
The physical TI-84 has features that go beyond what a browser-based version can replicate, including programmable applications, matrix operations, financial calculations, and the ability to connect to other calculators and sensors. However, for the most common academic use cases — scientific calculations, basic graphing, and descriptive statistics — the online version covers the same ground.
The online version has one significant advantage over the physical calculator: it is always available on any device with a browser, requires no batteries, and costs nothing. For students who left their calculator at home, are studying on a library computer, or simply do not yet own a TI-84, the online version provides immediate access to the same core functionality.
Looking for more free online tools? You can also try our Hours From Now Calculator to calculate future dates and times or use the MG to mL Calculator for quick and accurate unit conversions. Like our TI-84 Calculator Online, both tools are free, fast, and work instantly in your browser.
Frequently Asked Questions
Conclusion
The TI-84 is one of the most widely used calculators in education, and having access to its core functions online removes the barrier of needing to carry the physical device at all times.
This free TI-84 calculator online covers scientific calculations with full trig and log support, equation graphing with an adjustable viewing window, and descriptive statistics for data analysis — all in a browser with no installation required.
Use it for homework, study sessions, or any time you need a capable graphing calculator immediately available on the device in front of you.